This post is the second of a two parts series of articles on how to tune Akka configurations
- Part-1: Initial Akka Configurations
- Part-2: Gather and analyze Akka metrics with Kamon and stackable traits
Previously, we tried to adjust Akka configurations for some possible use cases. After we set up a configuration and have a system up and running, we’d like to know how well we did and “re-tune” the configuration where needed.
Part-2: Gather and analyze Akka metrics with Kamon and stackable traits
This part focuses on Akka metrics, meaning a high-level data on the Akka Objects that we’ve configured (i.e. Dispatchers, Routes, Actors (Routees), and Messages). We will consider how we gather them at Inneractive and give some useful tips.
Monitoring Tools for Akka
The Akka library does not include a native monitoring tool. However, there are a few tools that provide additional metrics for an Akka-based application (i.e. memory usage, trace information), profiling and further capabilities that help identify performance issues or identify a bottleneck.
To name a few:
-
Provides all necessary features, including key Akka metrics and span traces.
Takipi plugin provides actor events that can trigger debug snapshots of the stack trace, i.e. the state at the time of the error. By the way… It’s not free…
-
A powerful performance monitoring and management framework, with Spray and
Akka-Http instrumented features. However it’s most important feature, at least regarding our purpose, the X-ray, which gives deeper insight into key transactions, and is available only with a ‘Pro’ subscription.
-
Flame Graphs / VirtualVm or any other JVM profiling tool
-
Kamon
Kamon
Overview
Kamon is an open source tool for monitoring applications running on the JVM. It supports various backends and has modules that integrate and gather metrics for Akka, Play, Spray/Akka-Http and more.
Kamon uses Aspectj to add a layer of code before and after a method is executed, and in this aspect- oriented fashion records metrics data (e.g. Records time before and after processing of messages/futures/routing (See Appendix).
Here at Inneractive we use Kamon to gather all metrics, including application custom metrics, even in applications that do not use Akka, because it proves to perform better (CPU wise) than other alternatives.
It contains metric types functionalities like .histogram(..), .counter(..), .gauge(..) and .minMaxCounter(..)
Configuration for Kamon Akka metrics
Akka integration has a collection of metrics for actor, router and dispatcher objects. Firstly, they are all collected in our Exchange server. Soon enough our monitoring tools, Prometheus and Datadog went down / froze because of a crazy load of metrics. The reason is that we have 1000 to 1500 Actor instances. The metrics’ names include the instance name (it is not a Tag as you might expect). We do have our own tags like ‘environment’ and ‘host’, and about ~600 Exchange instances. There you get the vast number of metrics that our monitors could not handle.
In addition, the ‘aspect’ way of gathering metric’s data is quite expensive, performance wise.
Our metric configuration looks as follows:
"metric": {
      "filters": {
       "akka-actor": {
         "excludes": ["**"],
         "includes": []
       },
       "akka-dispatcher": {
         "excludes": [],
         "includes": ["**"]
       },
       "akka-router": {
         "excludes": [],
         "includes": ["**"]
       },
       "trace": {
         "excludes": [],
         "includes": [ "**"]
       }
     }
    ...
    }
As you may notice, we exclude akka-actor, which means all routees metrics (time-in-mailbox, processing-time, mailbox-size), and gather metrics for actors ourselves. This is because:
-
Routees metrics outnumbered all the others combined, since we have lots of actor instances, and we desperately needed our monitors to be up and running…
-
We don’t really mind about a single routee in pretty much all cases, so gathered information like average, sum, 95 can do the trick
-
The metrics’ names are somewhat awkward (partially because the name of the routees is like $a $b… and naming them requires them to be created explicitly in the code)
-
We know the names of our actors, and have a foothold in our own actor’s code; so we could easily gather metrics ourselves, and with a more concise information. In addition, we wanted metrics about the messages, processing time and the time it took the message to arrive.
Tips
-
When you route manually, meaning when you don’t have a router, or whenever you have created the routees explicitly, you can give them names yourself(see actorOf parameters).
-
Akka does not provide an API to know the size of the mailbox. Instead, you can monitor by:
-
Have a messages counter (like Kamon does)
-
Override the MessageQueue. Google it.
Configuration for Kamon Akka ActorSystem
As stated, the aspectj operating by Kamon is quite expensive, even when excluding of all routees metrics. By default, Kamon uses the default-dispatcher. If you don’t set a default-dispatcher yourself, the threadpool size of the default-dispatcher will be the number of cores. In practice Kamon told us that about 75% of the running threads were Kamon’s..
You can set a dispatcher for Kamon as follows:
"internal-config": {
 "akka": {
   "actor": {
     "default-dispatcher": {
       "fork-join-executor": {
         "parallelism-factor": 0.25,
         "parallelism-max": 2,
         "parallelism-min": 1
       }
     }
   }
 }
}
Here we allow up to two threads (but even one would probably be enough), with a parallelism-factor of 0.25, meaning up to two threads when the machine has at least eight cores. This does the job.
Appendix
class ActorMonitor.scala from the module kamon-akka
83 84 85 86 87 88 89 90 91 92 93 94 95 96 97 98 99 100 101 102 103 104 109 110 | def processMessage(pjp: ProceedingJoinPoint, envelopeContext: EnvelopeContext): AnyRef = { val timestampBeforeProcessing = RelativeNanoTimestamp.now try { Tracer.withContext(envelopeContext.context) { pjp.proceed() } } finally { val timestampAfterProcessing = RelativeNanoTimestamp.now val timeInMailbox = timestampBeforeProcessing - envelopeContext.nanoTime val processingTime = timestampAfterProcessing - timestampBeforeProcessing actorMetrics.foreach { am => am.processingTime.record(processingTime.nanos) am.timeInMailbox.record(timeInMailbox.nanos) am.mailboxSize.decrement() } ... } } … } |
Line 83 - 'processMessage' executes 'around'(before and after) message processing by the actor(jpg, line 88)
Line 84 - Takes start time before the message being processed
Line 88 - Invokes the method that handles message is processing
Lines 92-94 - Latency calculations
Lines 96-99 Updates metrics cache
Monitor with Stackable Actor Traits
We like to collect aggregated data for the routees and messages then.
To monitor time-in-mailbox, processing-time, mailbox-size that we excluded from Kamon metric configuration, we need to monitor ‘around’ the message processing, i.e. around the ‘receive’ method
It can be achieved by imitating Kamon’s usage of Aspectj as we just saw. However, we use stackable-traits mixed to the Actors, for a monitoring layer around ‘receive’.
I wrote about the stackable traits pattern. In Part-2 I described (a simplified version of) how we use stackable actor traits at Inneractive, with code samples.
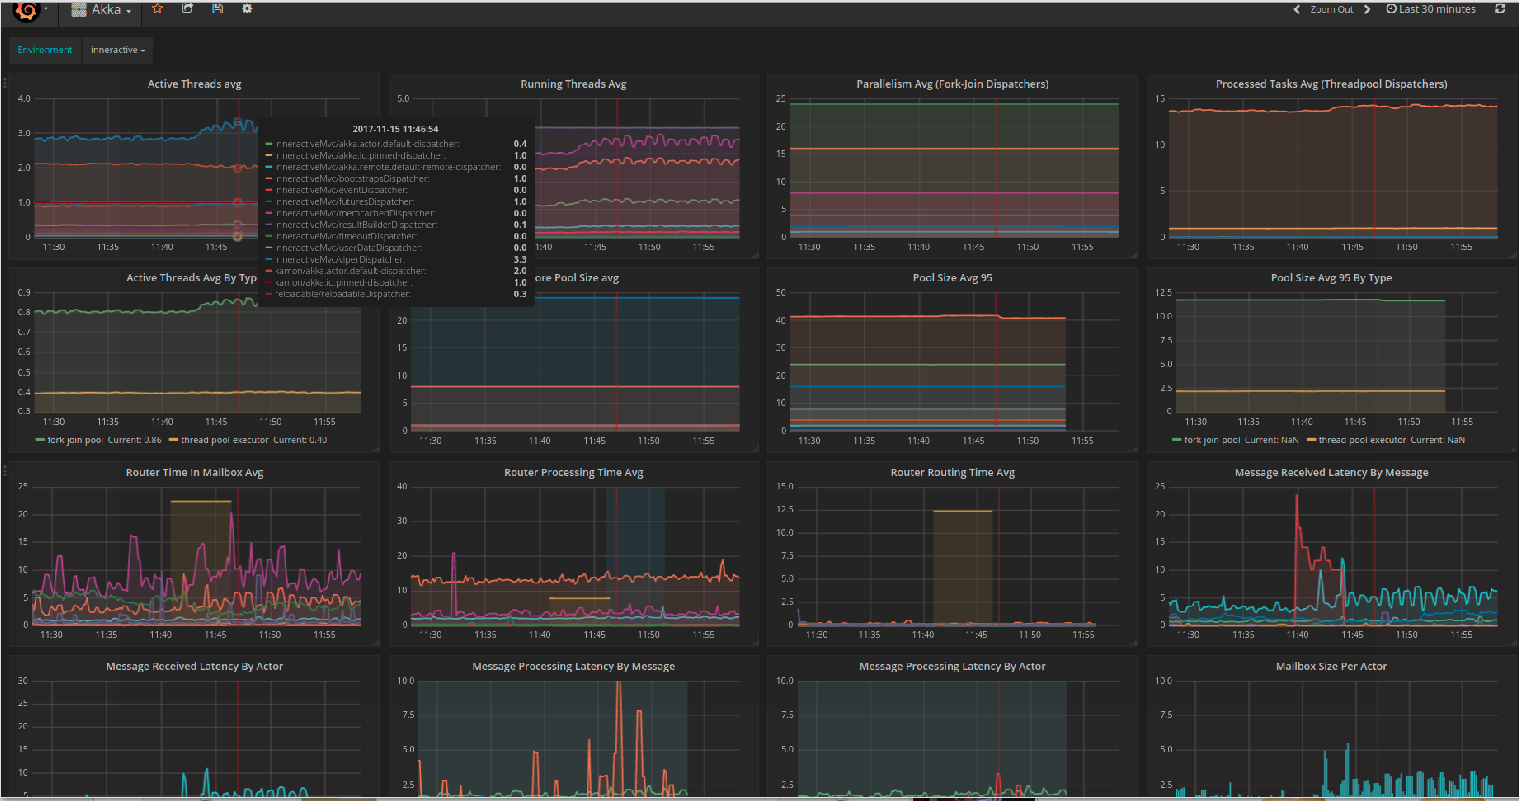
Dashboard Overview
Our dashboard consists of Kamon’s Akka metrics and custom metrics.
Akka metrics collection is explained in detail in the docs
Among all metrics, put special attention to:
-
‘active-threads’ and ‘running-threads’, these give a very good view of your threads distribution so you can tune the dispatcher’s configuration if needed
-
‘pool-size’, when you set upper, lower and increment factor and not a fixed size. This tells you how many threads are allocated in the pool, in practice.
-
‘processed-tasks’ - How busy is the executor, maybe more threads are needed
-
‘routing-time’ - indicates if the routing strategy fits.
-
Custom metrics - ‘time-in-mailbox by actor/message’ for routees. Maybe a specific message handling is causing the problem.
-
Custom metrics ‘message-start-process’ for routees. When the value is high, it can indicate that the receiver needs more resources or there are too many instances. This leads to lots of context-switches. An increase of the “throughput” parameter may help.
Wrapping up
Monitoring of the Akka objects plays an important and integral part of the tuning step (and is generally important for keeping track of the system behavior). There are various tools and ways to do so, Kamon is friendly and recommended, and you can gather the metrics yourself.