Everything so far has been design, and design argues for itself. This part is about evidence, which does not.
Three independent ways to know whether a workflow works are worth building, and they answer different questions. Most teams build one of them and then over-claim from it. An external corpus asks whether a step’s output is correct. The workflow reporting on itself asks where the process hurts, costs nothing, and is available on day one. Delivery metrics ask whether anything shipped sooner and at what price, which is the question a sponsor asks first and the hardest of the three to answer honestly. Each has a characteristic way of being gamed: a looser grader, a quieter agent, a confounded comparison group.
Assumes the artifacts and terminal states from part two, because every measurement here reads them.
Testing and evaluation
“How do you test this?” is really four questions. A workflow contains four kinds of thing, and each needs a different kind of test.
| The thing | Example | How you test it |
|---|---|---|
| A script | run state, a seam guard, branch setup | like any other software: run it, check the exit code |
| An adapter | code that reads or writes an external platform | check it still gives its consumer what that consumer needs |
| A judgment step | deciding, reviewing, classifying, planning | you can’t assert an opinion. Score it on tasks whose answers you know |
| The workflow itself | the whole thing, end to end | run it on a small task; check the result and the leftovers |
The two dead ends are trying to unit-test an opinion, and trying to eyeball a script. Sort the component into one of those rows first and the method follows.
Where to start
In this order. Each step is cheaper than the next.
- Validate the structure: does every component parse, and do its file references resolve? A second per commit.
- Test the scripts: one test per documented exit code, plus “run it twice and nothing changes the second time.” Most of these get re-entered after a failure, so repeating safely matters.
- Test the seams: for each pair of components that pass data, check the producer still emits what the consumer needs.
- Smoke-test one whole workflow on the smallest real task you have.
- Then build a scored task set for the judgment steps. Most valuable, most expensive: do it once you know what failure looks like.
The seams are where things quietly break
Borrow contract testing from microservices: the consumer writes down what it needs from the producer, and that expectation runs as a test on both sides whenever either changes. Only what the consumer actually uses gets pinned, so the producer stays free to change everything else. See Pact or this overview.
Not theoretical: in one observed case a component fetched an identifier and never wrote it out. The component that needed it failed for want of it, after the change had already been published. Two components, one unwritten assumption, no test at the boundary.
This is also the answer to “a component is used by five workflows, what did I just break?” Keep a generated map of which workflows use which component, and let a change select the suites to run.
Scoring a judgment step
You can’t write an assertion against an opinion. You can assemble tasks whose right answers you already know, run the step against them, and score it. The task set is the work; the scoring is easy.
Most of this is from Anthropic’s Demystifying evals for AI agents, which is worth reading in full:
- Start with 20–50 tasks taken from real failures: your bug tracker, not your imagination. Early on, changes have big effects, so a small set discriminates fine.
- A task is only usable if two people who know the domain would give the same verdict. Otherwise you are measuring your own ambiguity.
- Write down a known-good answer for each task. It proves the task is solvable and that your scoring works: the two problems that otherwise look like a weak agent.
- Include tasks where the right answer is “do nothing.” Most people skip this. If every task has a problem to find, the best-scoring agent is the one that always finds something. Include correct code that looks suspicious, and one task with nothing wrong at all.
- If everything fails, suspect the task. A 0% score across many attempts usually means the task is broken or ambiguous, not that the agent is incapable.
- Grade the result, not the steps taken. Checking that an agent followed a particular sequence of tool calls is, in Anthropic’s words, “too rigid and results in overly brittle tests”, capable models keep finding valid routes nobody planned for. If you do care about the path, check only that it didn’t do anything extra.
- Read a few transcripts before believing any score. A number can rise because the scoring got looser.
Two task sets are worth having: a planted one, where you introduce problems deliberately and record the answers, as your gate; and a replay one, which costs nothing to write: take real finished work that already has real human feedback, run the workflow against how things looked then, and compare.
If a model does the grading, spot-check its verdicts against human ones now and then, and watch for it drifting lenient, a wrong answer marked correct inflates everything downstream.
Living with randomness
The same input doesn’t give the same output twice, so one run tells you little. Run each task a few times and decide which you need: at least one attempt succeeds (fine when you only need one good answer), or every attempt succeeds (when consistency is the point). Those two diverge fast as attempts increase, so say which one you are quoting.
Then two practical rules:
- Start every attempt from a clean slate. Leftover files and warm caches cause failures that look real but aren’t.
- Compare the outputs, not just the pass rate. A step that finds three good things, then three different good things, can score identically each time and still be impossible to depend on.
Cheap checks that punch above their weight
Tripwires. Emit one number per phase: how much of what it produced is actually usable. The example that earned this a permanent place: a review step produced twelve findings, and none of them pointed at a real file and line. Nothing would ever be posted. Every exit code was zero, so no task set would have caught it. One counter made it obvious.
Relations you can assert with no answer key. When you can’t say what the right output is, you can often say how two outputs must relate:
- shuffle the input order → the decisions should be the same
- feed the same item twice → it should be deduplicated
- feed something with nothing wrong → the output should be empty
These need no task set, take minutes to write, and catch instability single examples never will. (The formal name is metamorphic testing.)
Testing a workflow that needs human approval. This looks impossible, since something has to approve the plan. The wrong fix is a “skip the gate” flag, which removes the very thing you wanted to cover. Instead, have the test write exactly the approval record a human would have written: same file, same format, same hash. The gate check downstream passes unchanged, because it cannot tell the difference and doesn’t need to. Only the source of the approval changes. The same trick is how a gate later becomes an automatic policy (part five).
Where the test cases come from
Before building any of it: read what actually happened. Sample real runs, note what went wrong in plain words, group those notes into named failure categories, and count how often each occurs. Thirty to fifty by hand is the usual starting point.
The one-line version, from Hamel Husain and Shreya Shankar’s work on evals, is hard to improve on: look at your actual data, by hand, before building any automated metric. A task set built without this tests the failures you imagined; one built after it tests the failures you have.
What your runtime may already do for you
Check before building anything. A capable agent runtime may offer:
- A “without the component” comparison: run the same task set twice, once with the component installed and once with it removed, and compare the scores. This is an ablation, and it is the single most valuable measurement available, because it answers “does this thing earn its place?” rather than “did the model succeed?” A workflow can score 80% on your corpus while your planning skill contributes nothing: the model was getting there anyway. You only find that out by taking the skill away and running the same twenty tasks again.
- Separate grading for “did it trigger” and “did it do the right thing”: two different bugs, and the first is easy to miss entirely.
- Deterministic graders: pattern matches, “was this tool called”, “was this file created”, alongside model-based scoring.
- Repeats, pass thresholds, cost ceilings and machine-readable output, which is all CI needs.
Claude Code has a claude plugin eval command that does exactly this: its --ablation with-without
mode runs a no-plugin baseline arm and reports the delta. As of 2.1.259 it is early access and
undocumented, so not everyone has it and none of the detail is guaranteed to hold. Worth watching
rather than building on, because a runtime that runs the comparison for you turns the most valuable
measurement here into a flag.
What they generally don’t give you: checks partway through a long workflow, partial credit, or any way to assert which sub-agent ran on which model. For those, split the workflow into one case per phase, or check the files the run left behind, a good reason for phases to write files.
Five checks that need no test set at all
Assert these after any run, with no answer key:
- did it finish in one of its declared end states, rather than just stopping?
- does every file it promised exist?
- was every gate satisfied by a real approval?
- did the loop stay inside its limits?
- were there any stops that weren’t designed: a question that halted it, a missing input?
If you build nothing else, build these five and the component map. They are cheap, need no labeled data, and between them catch most of the ways a workflow quietly rots.
Further reading
- Demystifying evals for AI agents, Anthropic. Task-set design, graders, anti-patterns. Start here.
- LLM evals FAQ, Hamel Husain, and the error-analysis method behind “read your data first”.
- Pact, contract testing for the seams.
- Metamorphic testing, asserting relations instead of answers.
- Trajectory evals, LangChain, if you decide you do want to grade the path.
- Handling non-determinism, repeats and aggregation.
Everything above grades the workflow from the outside. There is a second approach, cheaper and available on day one: the workflow reporting on itself. That is the next part of this one.
Making the workflow evaluate itself
Every technique so far grades a workflow from the outside: build a corpus, run it, score the output. That is indispensable and expensive: the corpus is the work, and you cannot build one before you know what failure looks like. Which is the well-known bootstrapping problem: the teams who most need evals have no labeled data yet.
There is a second axis, and it inverts the arrangement. Have the workflow report on itself. Each dispatched step records where it hurt; the orchestrator sums up its own run; those records aggregate across many runs, per workflow and per component. No labeled data, no answer key, and it runs on the real distribution of work rather than the one you imagined.
The two are complements, not alternatives:
| External evals | Self-reported friction | |
|---|---|---|
| Question answered | is the output correct? | where does the process hurt? |
| Needs a labeled corpus | yes, the expensive part | no |
| Distribution tested | the one you authored | the one you actually get |
| Scales with | authoring effort | usage |
| Available | after you know the failure modes | immediately |
| Can it be gamed | by a looser grader | by a quieter agent |
Crucially, the second bootstraps the first. The taxonomy that self-reporting produces is precisely the open-coding-then-axial-coding step a corpus needs, except the agents do the open coding as they go, instead of a human reading traces weeks later.
Exercise the design deliberately
Passive collection tells you about the work you happened to do. To learn about the design, choose the work so it spans the design’s axes. A useful spread for a family of workflows:
- one item requiring a schema or data migration (exercises irreversibility and generated artifacts);
- one that is pure logic, deliberately trivial;
- one that cannot be completed without touching a protected or “ask first” file (does the workflow notice the constraint, or edit through it?);
- one that changes a published interface (exercises back-compat judgment, which is what reviewers actually argue about).
The trivial one is not filler; it is the control. If a task with no migration, no new model and no generated files still costs the full apparatus (every phase, every gate) that is fixed overhead, and fixed overhead is invisible unless something cheap is measured beside something expensive.
What a self-report has to contain
Free-text retrospectives do not aggregate. A structured record does, and the field list is where the value is:
- The component it is about: not the phase. This is the primary axis; without it every finding collapses to “the workflow is annoying”. Validate the name against a known list, or you will get typos and the non-answer “the workflow”.
- Impact (what it did to this run: blocked / caused rework / merely slow) kept separate from severity (what it would do to a future one). They are orthogonal: a trivial papercut can block, and a serious latent gap can cost nothing today.
- Evidence, required and non-empty. It is the only thing separating a finding from an opinion: a command and its output, or a file and a line.
- A signature, so the same problem reported by four runs collapses to one row.
- Who reported it, which is both a compliance denominator and the difference between a step’s own view and the orchestrator’s outside view of it.
- Optionally a suggested fix, optional on purpose, because requiring one invites invented ones.
The nil protocol
A step that hit no friction still files a report: the same self-report described above, carrying an explicit “nothing hurt” value rather than simply not being written.
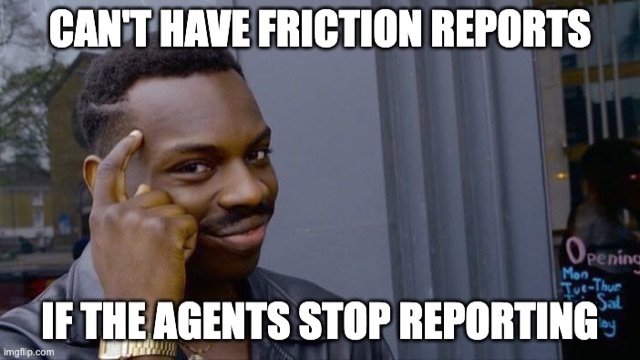
Without it, silence and not-bothering are indistinguishable, and those two mean opposite things. A required nil also gives the count a denominator: three frictions across forty steps, rather than three across an unknown number. The failure it prevents is specific. Fix a component, watch the reports drop, and you cannot tell whether the component improved or the agents went quiet. That is the same trap named earlier for corpora without a clean control, and it is the cheapest safeguard in the design.
The rollup, and what its columns must not hide
Aggregate by (component, signature), then print, per group:
- count and distinct runs, separately. Four records from four runs is four independent confirmations; four from one run is one run tripping repeatedly. Same count, opposite meanings.
- breadth: which workflows reported it, by name. This column is the answer to “is this a shared design fault or one workflow’s wording problem”, and it is how a fault in a component used by five workflows earns five times the attention.
- both raw and per-workflow-normalized severity. Shared components will accumulate more findings simply by being used more; printing only the raw total confirms that hypothesis by construction, and printing only the normalized one hides the real total cost. Print both and say which you are quoting.
- a reporting-hygiene section: runs that filed neither findings nor nils, findings with suspiciously thin evidence, unknown component names. This is the part that keeps the rest honest, and it is the only place hard targets belong: reporting rate and evidence present, never friction counts.
Then fix, and run the same work again
The improvement loop closes by re-running the same items on the improved workflows. That comparison is worth something only if the second run is genuinely a second run:
- fresh sessions, with no transcript of the first in context;
- reset state: the tracker items returned to their starting condition, prior artifacts archived rather than left where an autodetect glob can find them, caches and databases cleared;
- the software tagged at both points, and anything installed-by-copy re-installed, or the second wave silently runs the first wave’s components;
- the task specifications untouched. If the first run revealed that an item was ambiguous, resist clarifying it. That is the most tempting and most invalidating edit available;
- the previous attempt’s traces removed. Agents have been observed gaining an unfair advantage by reading the version-control history of earlier trials, so a same-task re-run must not leave the first attempt’s commits lying around.
What the comparison may honestly claim
Two measures survive the confounds:
- Recurrence of named frictions: per item fixed, a binary: did it come back? Most direct, least confounded, and it needs no baseline arithmetic.
- Unplanned stops per run: anything that is not a designed gate: a question that halted the run, a stuck terminal state, a missing artifact, a guard firing.
Then, as supporting evidence: operator interventions, terminal states, loop iterations, artifact completeness, gate integrity, and counts of expensive operations (environment boots, dependency re-locks, full-suite runs, human waits), which are cache-proof, unlike elapsed time.
Not evidence: wall-clock, token cost, raw finding counts, lines changed. And report per item; never average across items, because difficulty varies and the average hides the interesting cases.
State the confounds rather than burying them: the sample is small, it is one codebase, and the operator has seen the work before, which no process controls. The claim available is “these specific frictions were removed”, not “the workflow is better”. Where a claim does reach beyond the workflow’s own internals (that delivery got faster, say) it needs the comparison discipline below, especially the negative control.
Failure modes of the method itself
- Self-report bias. A step is a poor witness to its own confusion. The orchestrator’s outside view of a step, and the step’s own view, are different data, collect both and keep them distinguishable.
- Only dispatched steps can report as separate voices. A step invoked inline by the orchestrator has no independent context, so its “self-report” is really the orchestrator’s. If per-step attribution matters, that is another reason to dispatch the step.
- Telemetry must never be able to fail a run. Give the recorder exactly two outcomes (recorded, or bad usage) and keep it off every failure path. A measurement layer that can break a run gets switched off within a week, and then you have neither.
- Never set a target on friction counts. “Fewer than ten findings next time” rewards silence.
- Separate harness friction from workflow friction. Findings caused by how you ran the experiment (contention between parallel runs, a shared container, an expired credential) are about your harness, not the design. File them under a distinct label or they will misdirect every fix that follows.
Why this is the highest-yield thing to build first
It needs no corpus, so it is available immediately; it produces the failure taxonomy that a corpus later requires; and its output is self-sharpening: a named friction that recurs is a regression test that wrote itself. Fix it, record the signature, and every later run checks for its return at no cost.
Measuring whether it delivers
The first two axes are inward-facing. Corpus evals ask whether a step’s output is correct; self-reported friction asks where the process hurts. Neither can tell you whether anything was delivered sooner, or what it cost, and that is the question a sponsor asks first.
| Axis | Question | Data needed | Gamed by |
|---|---|---|---|
| External evals | is the output correct? | a labeled corpus | a looser grader |
| Self-reported friction | where does the process hurt? | nothing; it self-instruments | a quieter agent |
| Delivery metrics | did it deliver, and at what cost? | the tracker, the forge, runtime telemetry | survivorship and confounded groups |
Most teams build exactly one of the three and then over-claim from it. They are not substitutes.
Four streams, and a division of labor that is easy to get wrong
Delivery measurement draws on four independent sources, and each owns something the others cannot supply:
| Stream | Owns | Grain |
|---|---|---|
| Runtime telemetry | spend and token volume, sessions, active time | session × component × model |
| Workflow telemetry | runs, outcomes, loop iterations, referee decisions, early exits, component calls | run × work item |
| Issue tracker | the work item’s lifecycle: created, transitions, comments, links | work item |
| Code host | branches, commits, pull requests, reviews, CI, deployments | pull request / branch |
Two rules follow, and both are counter-intuitive enough to state plainly:
- Cost only ever comes from the runtime. Nothing in a workflow’s own telemetry prices tokens. What the workflow stream contributes is the dimension the cost stream lacks, which workflow, which work item, which outcome. Runtime cost alone has no work-item dimension at all, and that gap is the entire reason both streams exist.
- Delivery outcomes only ever come from the tracker and the code host. Workflow telemetry says what a run did; it can never say whether delivery actually changed.
The join, and what breaks it
The spine is the work-item key. The tracker has it natively; the workflow stream carries it; the code host yields it from a branch-name convention (with the PR body and commit messages as fallbacks). Cost joins only indirectly (session → run → work item) which is the join no single system can perform alone, and the reason instrumenting the workflow is a prerequisite for costing anything.
Three consequences worth designing for up front:
- A workflow with no work-item key breaks the spine. Anything triggered by a repository or a pull request rather than a ticket must emit an alternative key, or its cost attaches to nothing.
- Some joins no system provides. The wait at a human gate (the approval record carries a hash but no timestamp, as noted above); the exact link from a run to the pull request it produced (inferred from a branch name unless the run stamps its id into the PR body or a commit trailer); and the identity map between tracker account, code-host login and commit email, which is a hard prerequisite for anything per-person.
- Cardinality is many-to-many. One item may have several runs and several pull requests. Fix the rules once (earliest start, latest merge, summed iterations) and exclude bot authors everywhere.
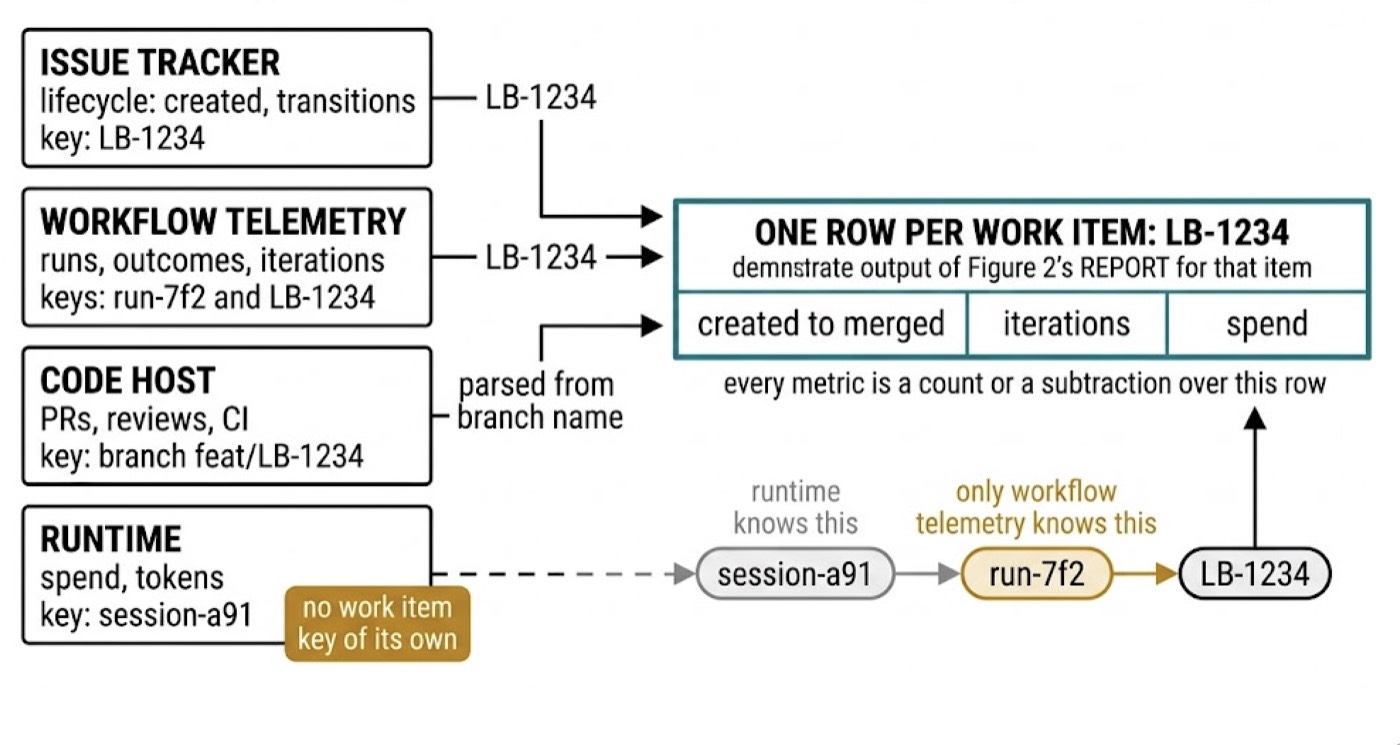
Figure 1: Cost only ever comes from the runtime, and the runtime has no work item dimension at all. The middle link of that chain exists only if the workflow records it, which is why instrumenting the workflow is a prerequisite for costing anything.
One row per unit of work
Reduce all of it to a single record per work item: created, started, first commit, PR opened, first review, merged, deployed, done; time in each status; reopens; review rounds; size and files touched; CI attempts; runs, outcome, iterations, gate rejections; and spend.
Every metric that follows is then a subtraction or a count over that row, which is what keeps a metric catalog from turning into a pile of bespoke queries.
Four lenses, and one rule about reading them
- Usage: is it actually being adopted: share of eligible items with a run; repeat use, which separates “tried it” from “adopted it” in a way a user count hides; funnel drop-off showing where runs die; the outcome mix.
- Efficiency: cycle time (started → done, excluding backlog), lead time, build time, time in each status, time to merge, review wait, rework rounds, discussion depth, size.
- Quality: first-pass CI success, reopen rate, escape rate (a defect linked back within some window), revert rate, follow-up churn, change failure rate.
- Cost: spend per delivered unit, spend on runs that produced nothing, waste ratio, spend per component, spend per loop iteration.
Efficiency is never reported without quality in the same view. A speed number shown alone invites precisely the trade nobody wants, and the invitation is hard to refuse once the number is on a slide.
The elapsed-time paradox
The previous section says elapsed time is not evidence; this section makes cycle time a headline. Both are right, and the distinction matters:
- A run’s wall-clock is confounded by caches, warm environments and machine load. Use operation counts instead.
- A work item’s cycle time is measured between events days apart in external systems. No cache touches it.
Same word, different clocks. Never mix them in one chart.
Comparing assisted with unassisted
The moment there is a number, someone will compare it to the unassisted case. The comparison is worth doing and easy to fake, so fix the discipline before the first chart:
- Label every work item as unassisted, assisted-any (a run was started, whatever became of it), or assisted-completed.
- Compare assisted-any against unassisted. It is tempting to compare only the runs that finished, but runs are abandoned precisely on the items that turned out to be hard, so excluding them removes the workflow’s worst cases and manufactures a win. Report the completed subset separately, labeled “when it completes”, never as the headline. This is the single most common way these numbers lie.
- Compare like with like. Same item type, same window, bots excluded.
- Band by size and by repository, and compare within band. A large change in a repository with a slow suite is not comparable to a small one elsewhere. Without banding, a difference in which items people chose looks exactly like a difference the workflow made.
- Summarize honestly. Median and p90, never the mean; show the difference with an interval, and if it spans zero, say “noise”; print both group sizes and show nothing for thin cells.
- Pair people against themselves. For anyone with items in both groups, compute their own median difference and check whether most people moved the same way. Differences between people (seniority, familiarity, how they scope work) are usually larger than the effect being measured.
- Run the same comparison on a metric the workflow cannot possibly affect. The lag between merging and someone finally dragging the item to done is pure bookkeeping; no coding workflow changes it. If the assisted group looks “better” there too, the groups differ for some other reason (most likely easier items being chosen) and the headline cannot be trusted. A negative control is the cheapest protection against fooling yourself, and almost nobody builds one.
- Show quality beside speed, always.
Even with all of it, this stays observational: people chose when to use the workflow. You can describe a difference; you cannot claim a cause. A causal claim needs randomization (alternating by week, for instance) which is worth doing once a baseline exists.
Anti-metrics
| Tempting | Why not |
|---|---|
| Run counts, invocation counts | Activity, not delivery. Trivially inflated |
| Token volume | An input. Use spend per delivered unit |
| Completed-runs-only timing as the headline | Survivorship; see step 2 |
| Total early exits as a failure count | A gate refusing to proceed is the gate working. Failure is a terminal state, not an exit |
| Lines of code | Rewards volume, which this tooling produces cheaply |
| Any per-person KPI | These are program metrics. Per-person views exist for the paired analysis, not for evaluating people |
And set no targets before a baseline exists. Targets set in advance are either trivially met or quietly abandoned. Measure for a full delivery cycle, publish the baseline with its spread, then set targets.
Instrumentation: the artifacts are the source; hooks are only the trigger
This closes a loop the design opened much earlier. Part two made artifacts the interface between phases for composability. It turns out they are also the only trustworthy measurement surface: in-session hooks observe tool calls, not workflow semantics, so anything a workflow concluded (an outcome, a verdict, a count) must be read from the file it already writes for its own correctness. No metric should ever depend on parsing prose.
The practical shape: choose the one moment when a run is definitively over, read the artifacts there, and emit everything at once, guarded so a single run cannot emit its terminal batch twice.
Two classes of signal no in-session instrumentation can reach: delayed human reaction (a thread resolved, an item moved days later) and downstream effects (whether the change was reverted, whether a defect was linked to it). Those need a scheduled reader over the artifacts and the external streams. If a workflow’s most important number is of that kind, the scheduled reader is part of the measurement design, not a later nicety.
Rules for whoever adds a metric
- Increment by exactly one per observed event. Never accumulate a computed quantity into a counter.
- Emit numerator and denominator separately, never a ratio. A pre-divided rate cannot be re-aggregated across runs.
- Mirror the failure path wherever you handle the success path. A crashed step otherwise leaves a span that never closes and a window that never shuts.
- Watch cardinality. Anything unbounded (a file path, a finding title, a branch name) does not belong in a dimension.
- Version anything you intend to trend. A prompt or rule change alters what a workflow produces; without a version dimension, a trend line silently splices two different systems together. It cannot be backfilled, so it has to be there from the first emission.
Shared metrics, owned metrics, and the tier that gets over-claimed
Most signals should be shared: one definition emitted by every workflow, sliced by workflow name. Resist the urge to fork them per workflow: a new terminal state belongs in the shared vocabulary, not in a private metric.
But workflows should also carry their own metrics, because the interesting quality signal is usually specific to what that workflow produces: a reviewer has precision and recall over findings; a build loop has iterations to green; a triage step has restraint. Name those distinctly so they cannot be mistaken for a shared series, and keep them scoped to the workflow that emits them.
That gives three tiers, and the distinction governs how each may be read:
| Tier | Meaning |
|---|---|
| Program | One definition across every workflow. Comparable |
| Owned | Meaningful only for this workflow, measured on its own runs and artifacts |
| Attributed | A program metric measured on delivery artifacts, restricted to work that used this workflow |
Attributed metrics are the ones that get over-claimed. They are measured on work items and pull requests, not on runs, so they would read identically if something else entirely caused the improvement. Report them as “the items that used this workflow”, never as evidence about the workflow alone.
One constraint that should govern every dashboard: cost is comparable across workflows; quality is not. Spend per run ranks any two workflows sensibly. Quality metrics are defined against what a workflow produces and have no counterpart in a sibling, so cross-workflow panels should carry only the shared run-and-cost signals, and every quality panel should be scoped to one workflow.
Trace a handful by hand before publishing anything
Before any aggregate goes on a dashboard, follow three to five known items end to end manually (one assisted, one unassisted, one that went wrong) and check that the record matches what actually happened. A single wrong status mapping produces confident, plausible, entirely wrong numbers, and nobody downstream will question a chart.
Continuous cross-checks earn their keep for the same reason: items marked done with no linked pull request, pull requests merged whose item never completed, branches matching no item, negative durations. Each one is a broken join, and a broken join fails silently.
A workflow that works on your machine, and that you can prove works, is still a private tool. Part five is the three transitions that make it something else: packaging it so others can install and depend on it, porting it to a different harness, and taking the human out of the gates that can safely lose one. Part six is where all of it still hurts.